
AVA, which stands for Advanced Video Analytics, is a cutting-edge platform that empowers you to transform your data into captivating, animated art with just three simple steps. Experience the convenience of creating personalized data visualization video content that truly captivates your audience like never before.
Whether you’re looking to share insights with colleagues, present findings to clients, or simply tell a story with your data, our tool makes it easy and intuitive to create beautiful visualizations. With customizable templates, charts, and graphs, you’ll be able to transform even the most complex data into a compelling narrative.
Skip to the 3-step process.
Benefits of Data Visualization Videos
In today’s fast-paced digital landscape, data is king. Every business, regardless of its size or industry, grapples with mountains of data pouring in from various sources. But here’s the catch: raw data alone is overwhelming and difficult to decipher.
That’s where data visualization steps in to save the day. By transforming complex datasets into clear, visual formats such as charts and graphs, it reveals trends and patterns that might otherwise go unnoticed.
As a financial marketer, using visual storytelling to communicate data is a given, but traditionally it’s been very time consuming, expensive, and challenging to create the desired visuals. Powerful Business Intelligence (BI) tools, such as Power BI and Tableau set the stage for internal reporting, but they don’t always deliver the impact needed for external audiences.
That’s where AVA changes the game. As a self-service data visualization video platform, AVA empowers businesses to create stunning video content in just a few simple steps. With AVA, your data becomes a compelling story—one that captures attention and drives action.
Step 1: Choosing your template
Ready to get started on your data visualization video? Choose from a growing library of chart templates to find the perfect fit for your data.
Hover over your options to see a preview of the type of video you will be creating, along with a description.
- Racing Bar Chart
Track the rise and fall of competing data points over time with a dynamic horizontal bar chart that highlights trends and shifts in ranking.
- Racing Column Chart
Showcase the evolving changes in your data with a vertical column chart that captures growth, decline, and competition over time.
- Racing Line Chart
Illustrate trends and fluctuations with a horizontal line chart that dynamically traces data changes over time.
- Donut Chart
Display proportional data in a visually engaging donut chart that highlights distribution, comparisons, and evolving trends.
Additional charts and combined charts are offered as part of the platform and any custom template can be requested to be made available through the enterprise tier.
Click Next when ready to move onto the following step.
Step 2: Branding
Once you’ve selected your template, you’re ready to start personalizing your video to match your branding.
First, type in a Title for your chart on the top left of your screen. Step 2 then prompts you to upload your company logo (recommended in JPEG or PNG format) and select one of many Google Fonts available to personalize your video.
If you have a specific font you would like to use, please Contact Support referencing your username/email so we can make it available for you.
The sidebar to the right shows you which step you are on, allowing you to jump back and forward between steps to make edits.
Your Project ID is unique and can be referenced if you go back to the project.
Click Next when ready to move onto the following step.
Step 3: Customize your video
Upload your data, add key milestones, customize every detail, and bring your video to life—all in just a few simple steps.
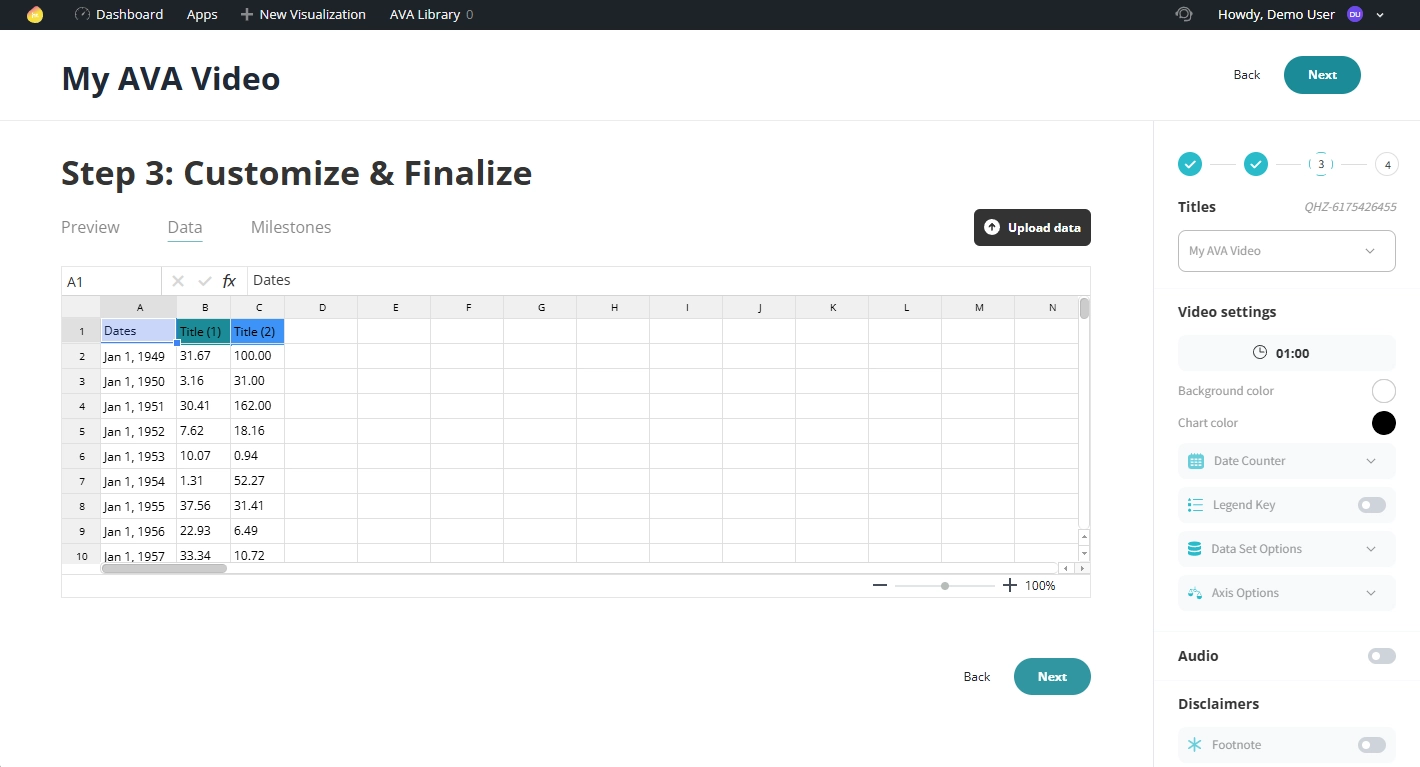
Start by uploading your data through the interactive spreadsheet or select the ‘Upload data’ button on the top right to import your CSV data file.
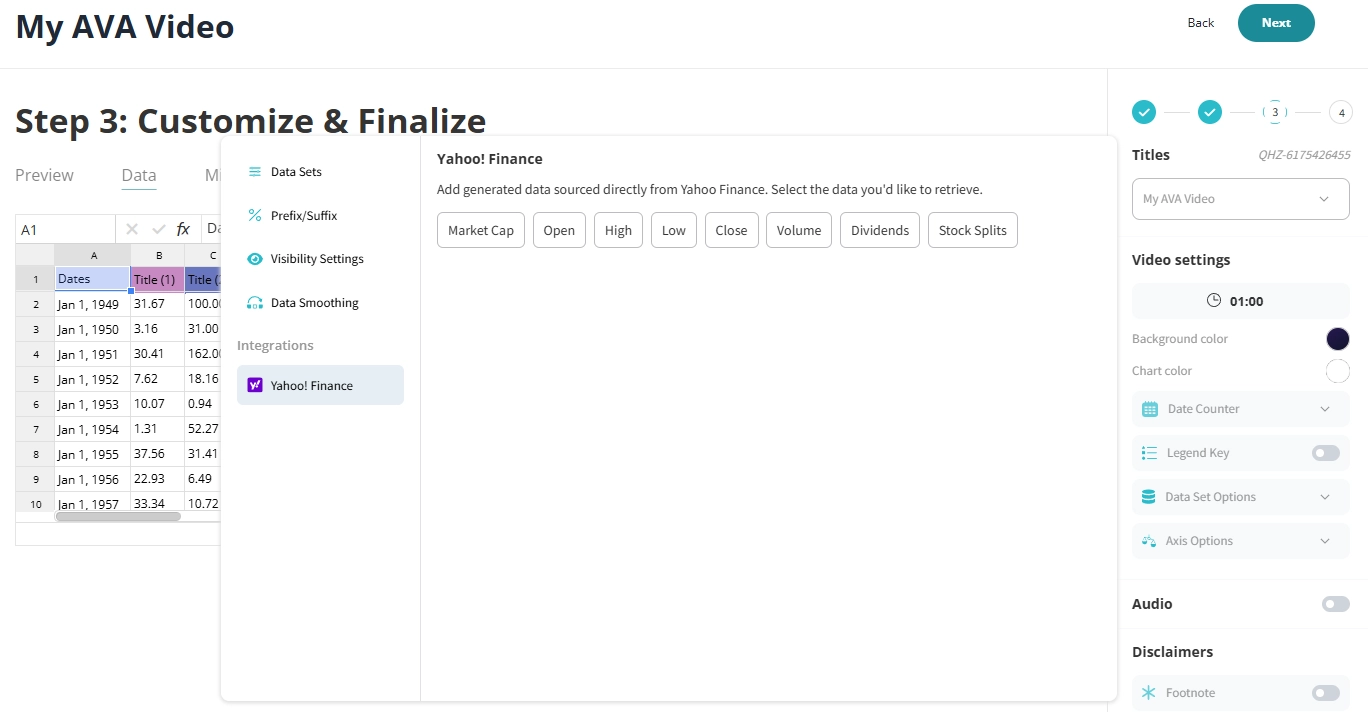
AVA Tip: Need help finding data? Use the Yahoo! Finance Integration (available with Pro and Enterprise plans) to generate data sourced directly from Yahoo Finance.
Incorporate Milestones into your video to highlight key events and dates in your timeline. Control how the milestones are displayed throughout your video, including slowing your video down when they appear for improved legibility. Finally, associate a graphic, set the date, and effectively convey your message to your viewers.
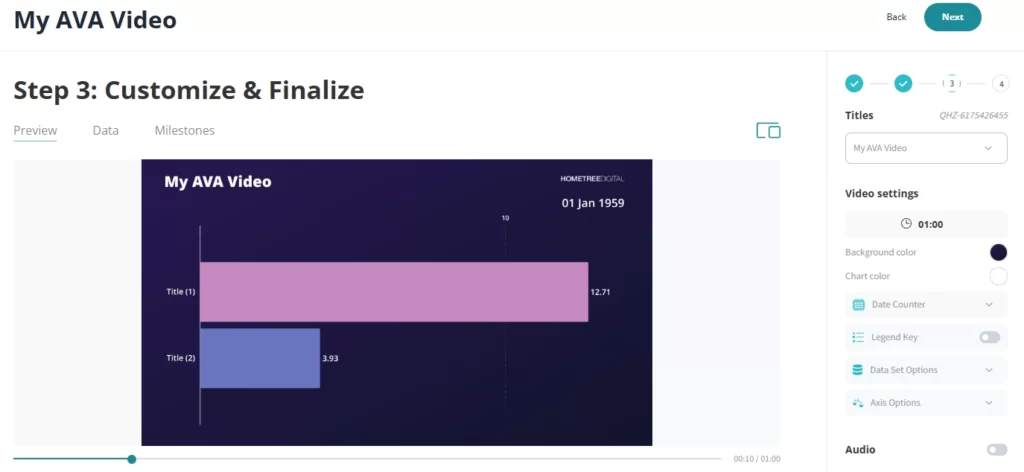
Preview your video as you go, tweak it, and perfect it in the preview tab, before hitting that final render.
Easily customize every element of your video
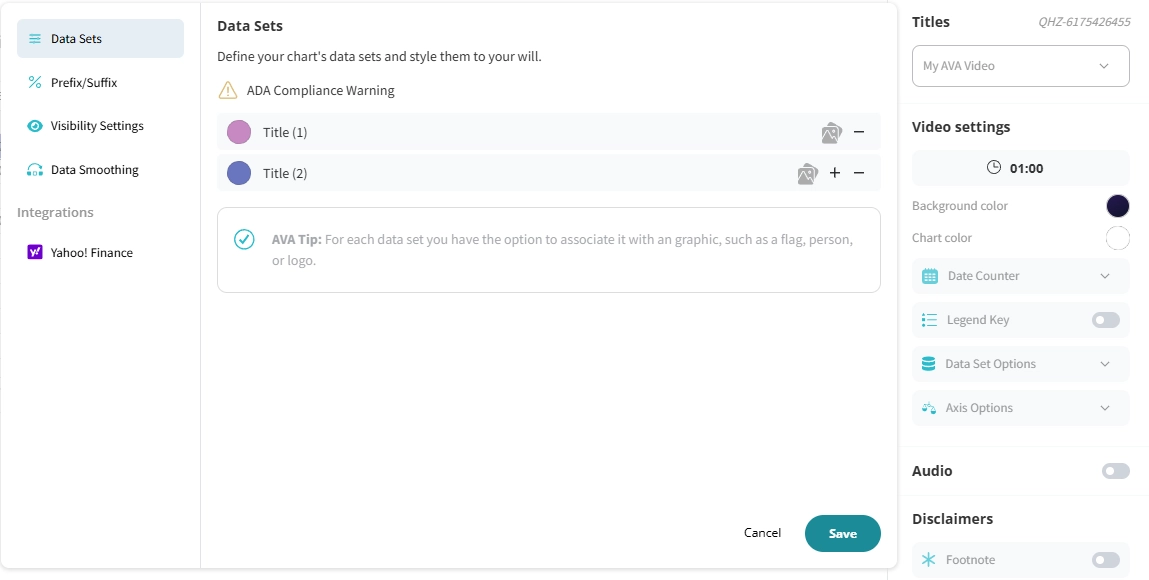
The Video settings bar offers a wide range of customizations for your video. Fully customize your video by adjusting elements like its length, subtitles, colors, placements, and more.
- Video Length: Your video length dictates the tempo of your video. If you are showing a lengthy date range, you will may want to add time, so it doesn’t feel as rushed and the content is digestible to your audience.

Consider the medium you will be posting this video on. For example, if you’re posting on social media the ideal length is approximately 30-60 seconds if the content allows for it.
- Background and Chart Colors: Select the background and chart colors for your video. You have the option to pick from a solid color, linear gradient, or radial gradient.
Watch for the ADA Compliance Warning. It’s like your design-savvy sidekick, flagging color combos that might be hard to read. You’ll see it pop up while you’re picking colors throughout the process—because looking good shouldn’t come at the cost of readability.
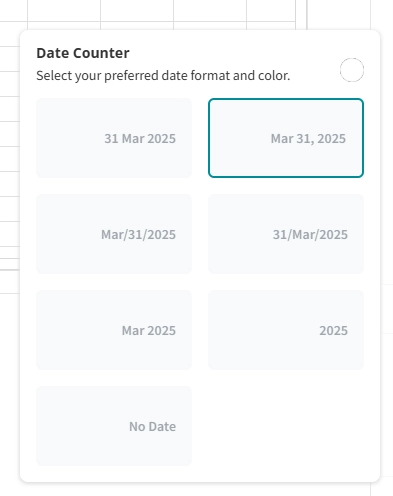
- Date Counter: The Date Counter shows your audience the exact date they are currently viewing data for. This adds life to your chart so they can actively see the progress. Select your preferred date format and color.
- Legend Key: Enable the Legend Key feature with its standard labels or customize to group your data and help your users to better understand and interpret the data.
- Data Set Options: Customize your data’s colors and add imagery to each set. For example, if you are showcasing competing countries, why not insert a country flag to add a bit of life to your chart?
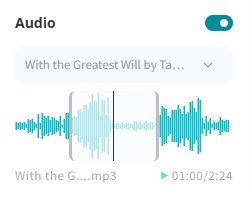
- Audio: Add audio to your video using our extensive audio library or upload your own custom audio.
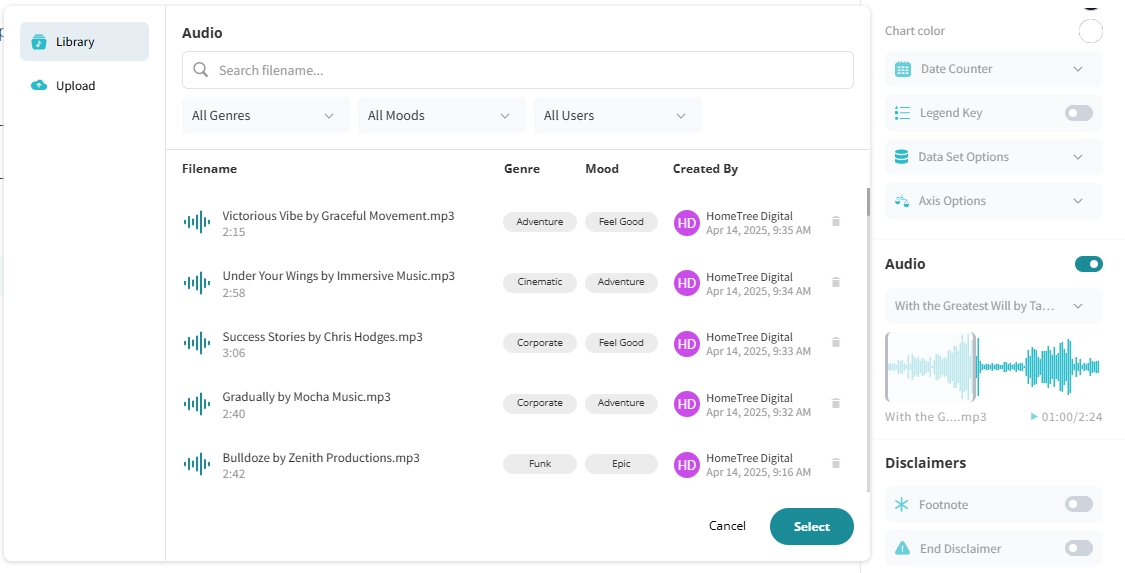
Slide through the audio wavelength to find the perfect beat for your video.
- Footnote: Add disclosure copy to the bottom of your video.
- Disclaimer: Add multiple disclaimer frames at the end of your video and keep compliance happy.
All Set!
Click Next when you are happy with your selections and ready to generate your video.
Share your video with colleagues, craft captivating presentations, or create engaging content on social.
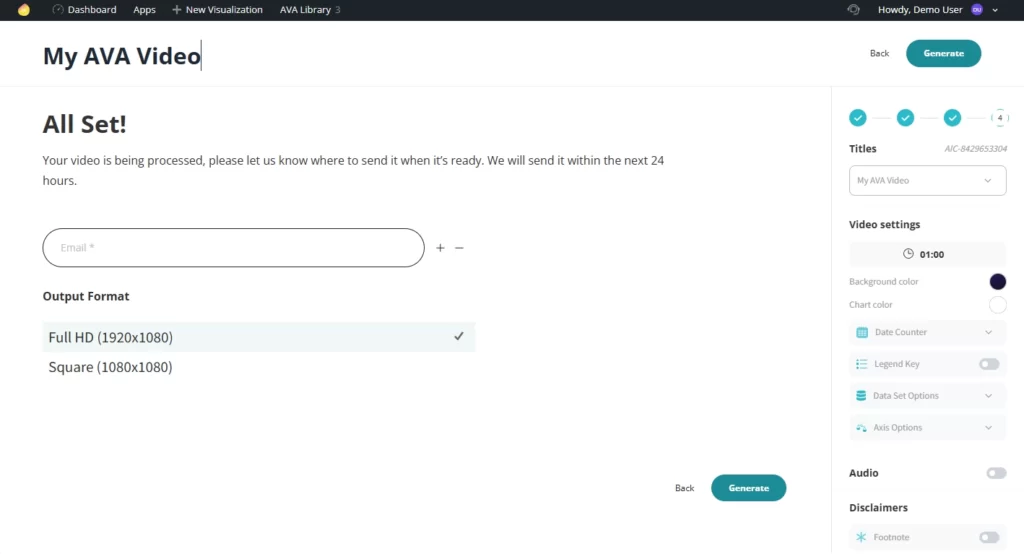
Select your Output Format, enter the distribution list and you’re all set. You can expect your video to be ready within 24 hours (in most cases, in less than 30 minutes).
You’ve completed all the steps to generate your data visualization video! We’d love to hear your feedback — how was the experience?
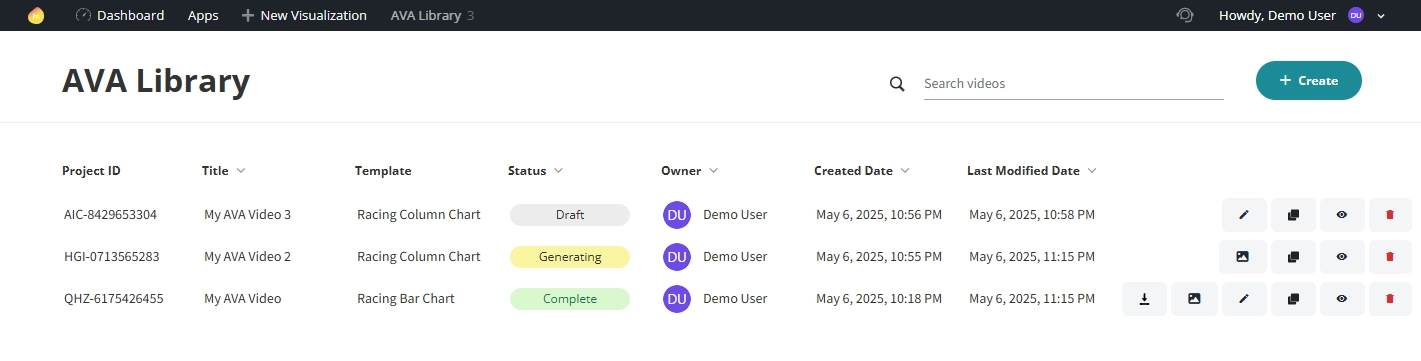
Now that you’ve created your first video, head to the AVA Library page to view a history of all your completed projects or drafts, whether they’re yours or from your team.
Conclusion
In conclusion, AVA’s Advanced Video Analytics platform empowers businesses to turn raw data into engaging, professional-quality videos with ease. If you’re new to data visualization or want to explore its broader value, check out our Insight: What Is Data Visualization? Definitions, Examples & Tools. With AVA’s intuitive interface and self-service tools, creating impactful video content takes just a few simple steps—making it easier than ever to communicate insights and connect with your audience.
As we continue to evolve AVA, we are excited to introduce more advanced features for our users. For instance, AI-powered recommendations will provide suggestions on milestones, color matching, and other enhancements to improve your videos.
We’d love your feedback—let us know what features or enhancements you’d like to see next in AVA! And if you enjoyed your experience, leave us a review on G2 and Google.
About HomeTree Digital
HomeTree Digital is a full-service digital marketing agency for financial services. We incorporate design & creative elements to our work and specialize in email marketing, social media marketing, paid advertising, videography, web development, custom integrations and automations. As a Salesforce Certified Partner, we can assist with the architecture, administration, or development of your CRM. If you are facing challenges in any of these areas, please reach out to us for assistance. Personalize your subscription to receive regular updates
HomeTree is defined as a wise resourceful home that provides knowledge, instills inspiration, encourages creativity, and protects. While harmoniously connecting its residents through its branches and roots to the outer world. This accurately describes the approach we take when it comes to our clients. We believe in excellent customer service and prioritizing you. Our mission is to provide you with the know-how to succeed in a rapidly evolving digital world.